Debugging a public-facing Salesforce Site can often feel like searching for a needle in a haystack. You might encounter the dreaded "Error Loading a Visualforce Page" message without any immediate indication of what went wrong. Since public site visitors don't log in with a standard user account, capturing a Salesforce guest user debug log requires a specific approach compared to internal user debugging.
In this guide, you will learn how to identify your site's guest user, set up trace flags effectively, and handle advanced scenarios like debugging webhooks or legacy environments. Whether you are running on the latest release or maintaining an older implementation, these strategies will help you uncover the root cause of site errors quickly.
Identifying the Site Guest User
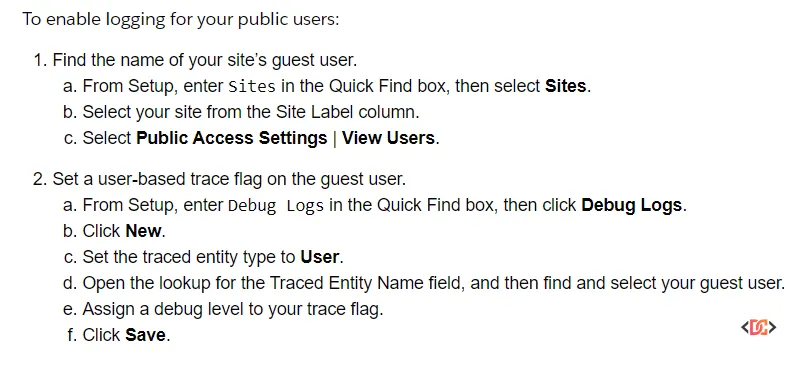
Before you can start logging, you must identify exactly which user record represents your public visitors. Every Salesforce Site has a dedicated Guest User license and a corresponding user record. However, these users don't always appear in the standard user list with obvious names.
To find the correct guest user, follow these steps:
- Navigate to Setup and search for Sites.
- Click on the Site Label of the site you wish to debug.
- Click the Public Access Settings button. This takes you to the Profile assigned to your guest users.
- On the Profile page, click View Users.
- Note the Full Name of the user listed there. This is the "Traced Entity" you will use for your debug log.
Alternatively, if you have many sites and are unsure which is which, you can search for *guest* in the search field when adding a new Trace Flag in the Debug Logs section. This will list all guest users across your various sites.
Setting Up Debug Logs (The Modern Way)
Since the Spring ’18 release, Salesforce has significantly simplified the process of debugging guest users. Previously, developers were required to set a specific browser cookie to trigger logs for public users, but this requirement has been removed for both Lightning Experience and Salesforce Classic.
To start capturing logs:
- Go to Setup > Environments > Logs > Debug Logs.
- Click New.
- For Traced Entity Type, select User.
- In the Traced Entity Name lookup, enter the name of the Site or the specific Guest User name you identified in the previous section.
- Select your Start Date, Expiration Date, and Debug Level (e.g., SFDC_DevConsole).
- Save the Trace Flag.
Note: Because all public visitors share the same guest user license, your logs can fill up extremely fast if your site has high traffic. Salesforce will truncate logs or hit the log-size limit quickly in these scenarios. It is best to set your trace flags for a very short duration and perform your testing immediately.
Advanced Debugging: Webhooks and API Requests
Debugging becomes more complex when you are dealing with inbound webhooks or third-party integrations that hit your Salesforce Site. In these cases, you aren't the one browsing the site; an external server is.
If you find that logs are not generating for these asynchronous requests, you might need to revert to a proxy-based approach to ensure the environment recognizes the debug request. While the Spring '18 update removed the cookie requirement for most browser-based activity, some complex integration scenarios still benefit from ensuring the debug_logs cookie is present in the header.
If you need to force a cookie via a proxy (for example, using Node.js), you can use a structure like this to ensure every request to your site carries the necessary debugging headers:
var httpProxy = require('http-proxy');
var express = require('express');
var apiProxy = httpProxy.createProxyServer({target: process.env.TARGET, changeOrigin:true});

apiProxy.on('proxyReq', function(proxyReq, req, res, options) {
  // Manually setting the debug cookie for the proxy request
  proxyReq.setHeader('Cookie', 'debug_logs=debug_logs,domain=.force.com');
});

var addDebugCookie = function(req, res) {
  apiProxy.web(req, res);
};

var server = express();
server.all('/*', addDebugCookie);
var port = process.env.PORT || 5000;
server.listen(port);
By deploying a small proxy like this on a service like Heroku, you can point your third-party webhook to the proxy URL, which then forwards the request to Salesforce with the debugging cookie attached.
Legacy Methods and Manual Cookie Insertion
In rare instances where the platform behavior doesn't trigger logs as expected, or if you are working in a highly customized environment, you can manually set the debug_logs cookie in your browser. This was the standard requirement during the Winter ’17 era and remains a useful trick in a developer's toolkit.
Using the Browser Console
You can quickly set the cookie by opening your browser's Developer Tools (F12) and entering the following in the Console tab:
document.cookie = "debug_logs=debug_logs; path=/; domain=.force.com; value=debug_logs";
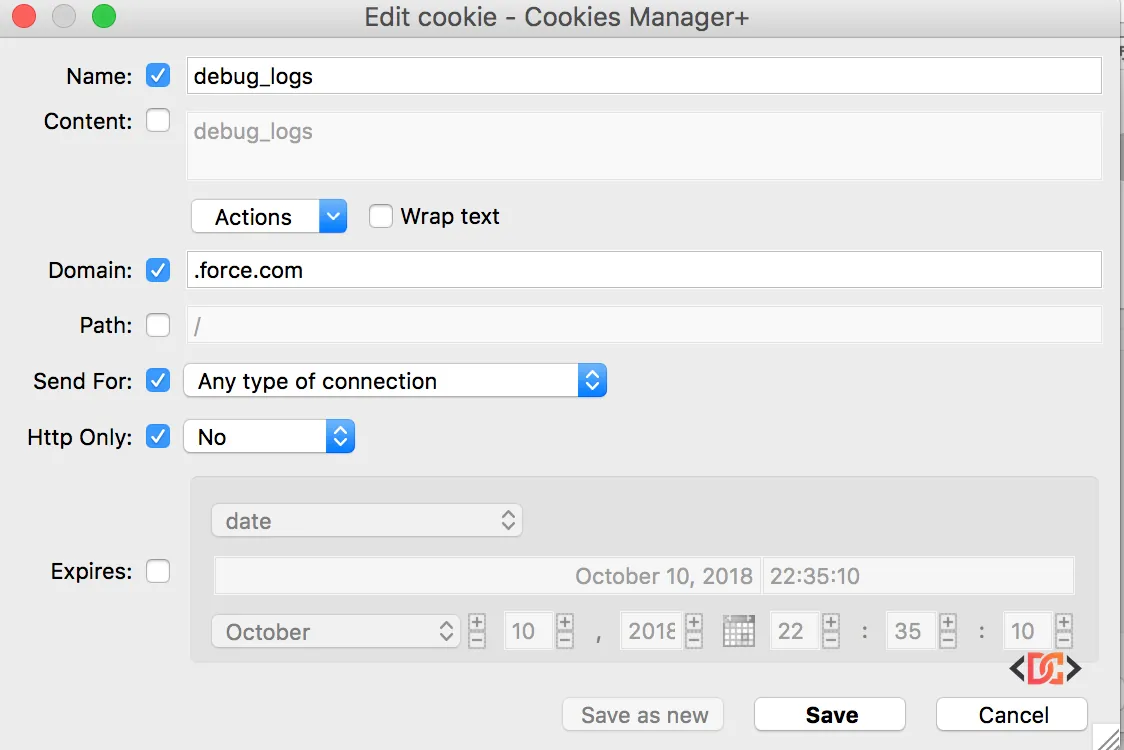
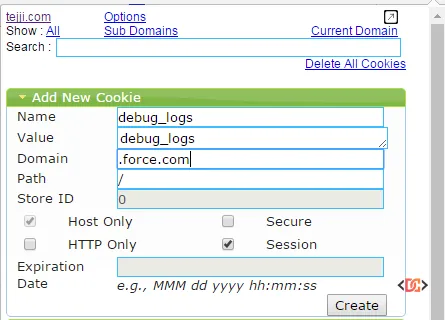
Using Browser Extensions
For a more visual approach, you can use extensions like Cookie Manager+ for Firefox or EditThisCookie for Chrome. You will need to create a cookie with the following parameters:
- Name:
debug_logs - Value:
debug_logs - Domain:
.force.com(Note the leading dot) - Path:
/
Frequently Asked Questions
Why are my guest user debug logs not showing up?
First, ensure the Trace Flag is active and hasn't expired. Second, verify you are looking at the correct user record. If the site is high-traffic, the log buffer might be full, or the logs may have been deleted due to the 250MB limit. Try clearing existing logs and refreshing the page.
Can I debug a specific visitor instead of all guest users?
Because all visitors share the same guest user identity, Salesforce cannot natively distinguish between "User A" and "User B" on a public site. If you need to isolate your own session, consider using a developer sandbox where you are the only one accessing the site.
Does this work for Lightning Communities (Experience Cloud)?
Yes. The process for Experience Cloud (formerly Communities) is identical. You identify the guest user associated with the community and set the trace flag on that user record.
Wrapping Up
Debugging Salesforce Sites doesn't have to be a mystery. By identifying the correct guest user record and setting up a trace flag in the Debug Logs section, you can gain full visibility into Apex exceptions, SOQL limits, and workflow executions occurring on your public pages.
Remember that while the Spring '18 update removed the strict requirement for cookies, those manual methods are still valuable for troubleshooting stubborn integrations or third-party webhooks. Keep your trace flags short, your log levels focused, and you'll have your site issues resolved in no time.