Debugging is an essential skill that separates proficient Salesforce developers from the rest. In the world of Apex, where code runs on multi-tenant architecture, finding the root cause of an exception or a logic error can feel daunting. However, with the right toolkit and mindset, you can resolve even the most complex issues efficiently.
In this guide, you will learn a step-by-step recipe for debugging your own Apex code, ranging from basic log statements to advanced interactive tools like the Apex Replay Debugger.
1. The Debugging Mindset: Start with the Basics
Before diving into logs and IDEs, start with your logic. A common technique among developers is Rubber Duck Debugging. Explain your code out loud to an inanimate object (like a rubber duck). By forcing yourself to explain what each line should do, you often discover the flaw in your logic before you even finish the sentence.
If you are dealing with a specific error, use the "Snake's Tail" approach. Start with the symptom—the error message or the incorrect data in the UI. Trace the chain of causation backward until you find the "head of the snake," which is the root cause of the bug.
2. Using System.debug for Quick Insights
The most common way to inspect your code's behavior is by inserting temporary System.debug statements. This allows you to verify variable values and execution flow in real-time.
System.debug('>>>> the value of x is ' + x);
Pro Tip: Use a unique prefix like >>>> in your debug strings. This makes it significantly easier to filter through thousands of lines of log data to find your specific output. Remember that logs are truncated after 2MB, so keep your debug statements focused.
To view these logs in Salesforce: 1. Navigate to Setup > Monitoring > Debug Logs. 2. Click New and select the User you want to monitor. 3. Set the Start and Expiration dates and the appropriate Debug Level (e.g., SFDC_DevConsole).
3. Leveraging the Developer Console
The Salesforce Developer Console is a powerful, web-based tool for debugging without needing a local IDE. It offers several features that are indispensable for troubleshooting:
- Logs Tab: View and filter execution logs immediately after running code.
- Execute Anonymous: Test snippets of Apex code or trigger logic without creating a permanent class.
- Query Editor: Run SOQL queries to verify that your code is interacting with the database as expected.
- Checkpoints: You can set up to five checkpoints in your code to capture the state of variables at a specific moment in time, similar to breakpoints in traditional IDEs.
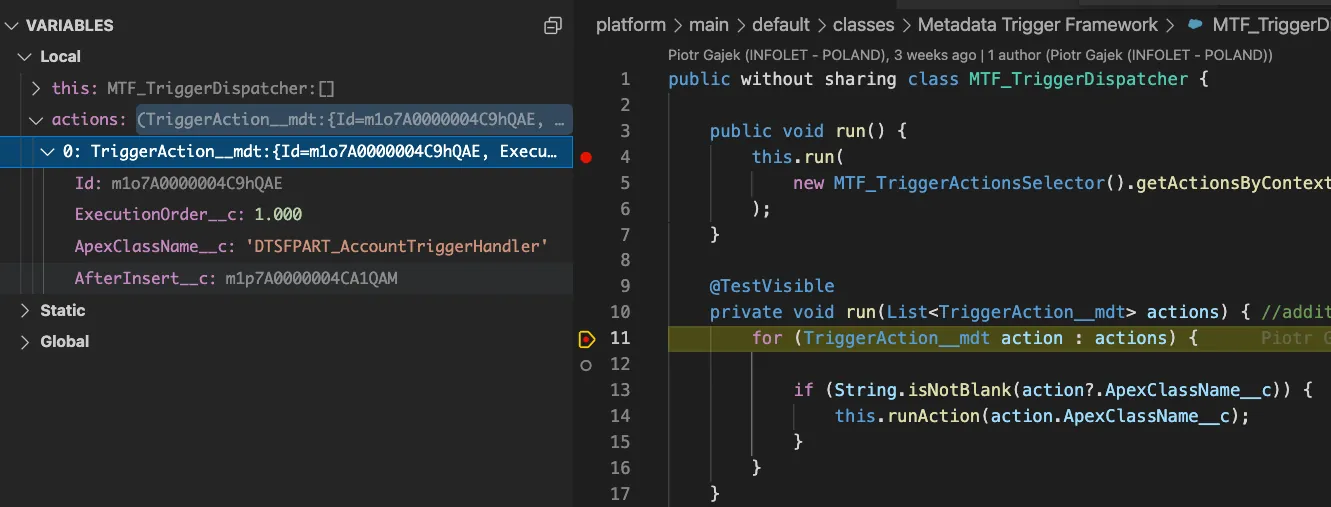
4. Modern Debugging with VS Code and SFDX
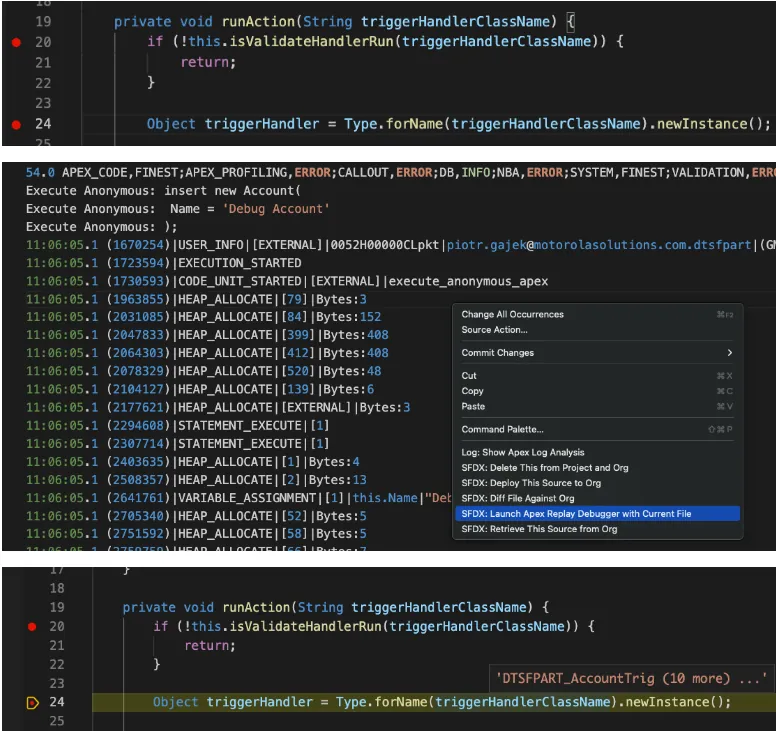
For a more professional development experience, you should use Visual Studio Code with the Salesforce Extension Pack. This setup provides access to the Apex Replay Debugger, which allows you to "replay" a log file as if you were stepping through live code.
How to use the Apex Replay Debugger:
- Set line breakpoints in your
.clsor.triggerfile by clicking to the left of the line numbers. - Open the Command Palette (
Ctrl + Shift + P) and runSFDX: Turn On Apex Debug Log for Replay Debugger. - Reproduce the issue in your org or run an anonymous Apex script.
- Run
SFDX: Get Apex Debug Logsand select the relevant log. - Right-click the log file and select Launch Apex Replay Debugger.
Streaming Logs in the Terminal
If you prefer working in the command line, you can "tail" your logs to see them in real-time as they are generated. Use the following Salesforce CLI command:
sf apex tail log --color | grep 'USER_DEBUG\|FATAL_ERROR'
For Windows PowerShell users:
sf apex tail log --color | select-string -pattern USER_DEBUG,FATAL_ERROR
5. Advanced Strategies for Complex Scenarios
Sometimes, standard logs aren't enough—especially in managed packages or long-running asynchronous processes. In these cases, consider these professional techniques:
Create a Unit Test
Unit tests are not just for deployment; they are incredible debugging tools. A test allows you to isolate your code in a controlled environment with specific data. Use System.assertEquals(expected, actual) to verify your logic.
@isTest
public with sharing class Test_Logic {
  static testMethod void testCalculation(){
    System.debug(Logginglevel.INFO, 'Testing calculation logic...');
    Integer result = MyClass.calculate(10, 20);
    System.assertEquals(30, result, 'The calculation should return 30');
  }
}
Custom Log Objects
If you are troubleshooting an intermittent issue in a production environment, you can create a custom "Log" object. Write a utility class that inserts records into this object whenever an exception is caught. This provides a persistent history of errors that won't be cleared like standard debug logs.
Interactive Debugger
For enterprise-level debugging, Salesforce offers the Apex Interactive Debugger. This is a paid feature that allows you to pause execution in a sandbox or scratch org and inspect the state of the application in real-time.
Wrapping Up
Mastering Apex debugging is a journey. Start with simple System.debug statements and the Developer Console. As you grow more comfortable, transition to VS Code and the Replay Debugger to gain deeper insights into your execution flow.
Remember: if you're feeling frustrated, take a break. Often, the solution becomes clear after you step away from the screen for a few minutes. If you are still stuck, prepare a clear explanation of your problem and your findings to share with a colleague—this process alone often leads to the breakthrough you need.